PROJECT NOTEBOOK / CITIES AS SYSTEMS
From a walk to the systems of a city.
How do we evaluate a greenway, rebalance shared bikes or introduce a district online? Three Cornell course projects approach the experience of a city from different directions.
A retrospective of team coursework, read alongside the original material and the individual contributions recorded in the project fieldbook.
SYSEN 5400 / 17 MAY 2023
Greenways: inspect the measure before the ranking.
The Pedestrian Greenway Optimization System report begins with stakeholders, translating resident, visitor, business and public-service perspectives into goals, decisions, metrics and utility functions. Candidate choices include space types, paths and vegetation.
The team describes generating and checking 10,000 candidate architectures, then using Pareto and fuzzy-Pareto analysis to identify options worth considering. Cost, satisfaction and visitor-related measures shape that comparison.
The report also leaves useful questions open. When cost and performance behaved unexpectedly, it revisited the performance measure. Its conclusion identifies the influence of simulated survey data and the need for on-the-ground observations. I would read those checks alongside the candidate results.
On revisiting the research, I would ask whether another design improves one of cost or performance without worsening the other. If not, the candidate merits further comparison. Whose experience does the performance measure represent, and would different simulated inputs move it off the frontier? Pareto analysis narrows the options; the final choice still needs a concrete account of the needs.
- 01
Needs to goals
Identify the participants and connect their needs to design goals.
- 02
Generate and filter
The report describes 10,000 candidate architectures, checked for duplicates and constraints before evaluation.
- 03
Compare and review
Use Pareto analysis to find candidates, then examine how the evaluation measures shape the results.
Source locations: §§2, 3.2.3, 3.5 and Conclusion. My contribution & reflection ↗
ORIGINAL PLATES / CORNELL / 17 MAY 2023
Open the figures. Follow the analysis.
Start with needs, generate candidates, then question the comparison. Three original team figures give the written account a closer view.
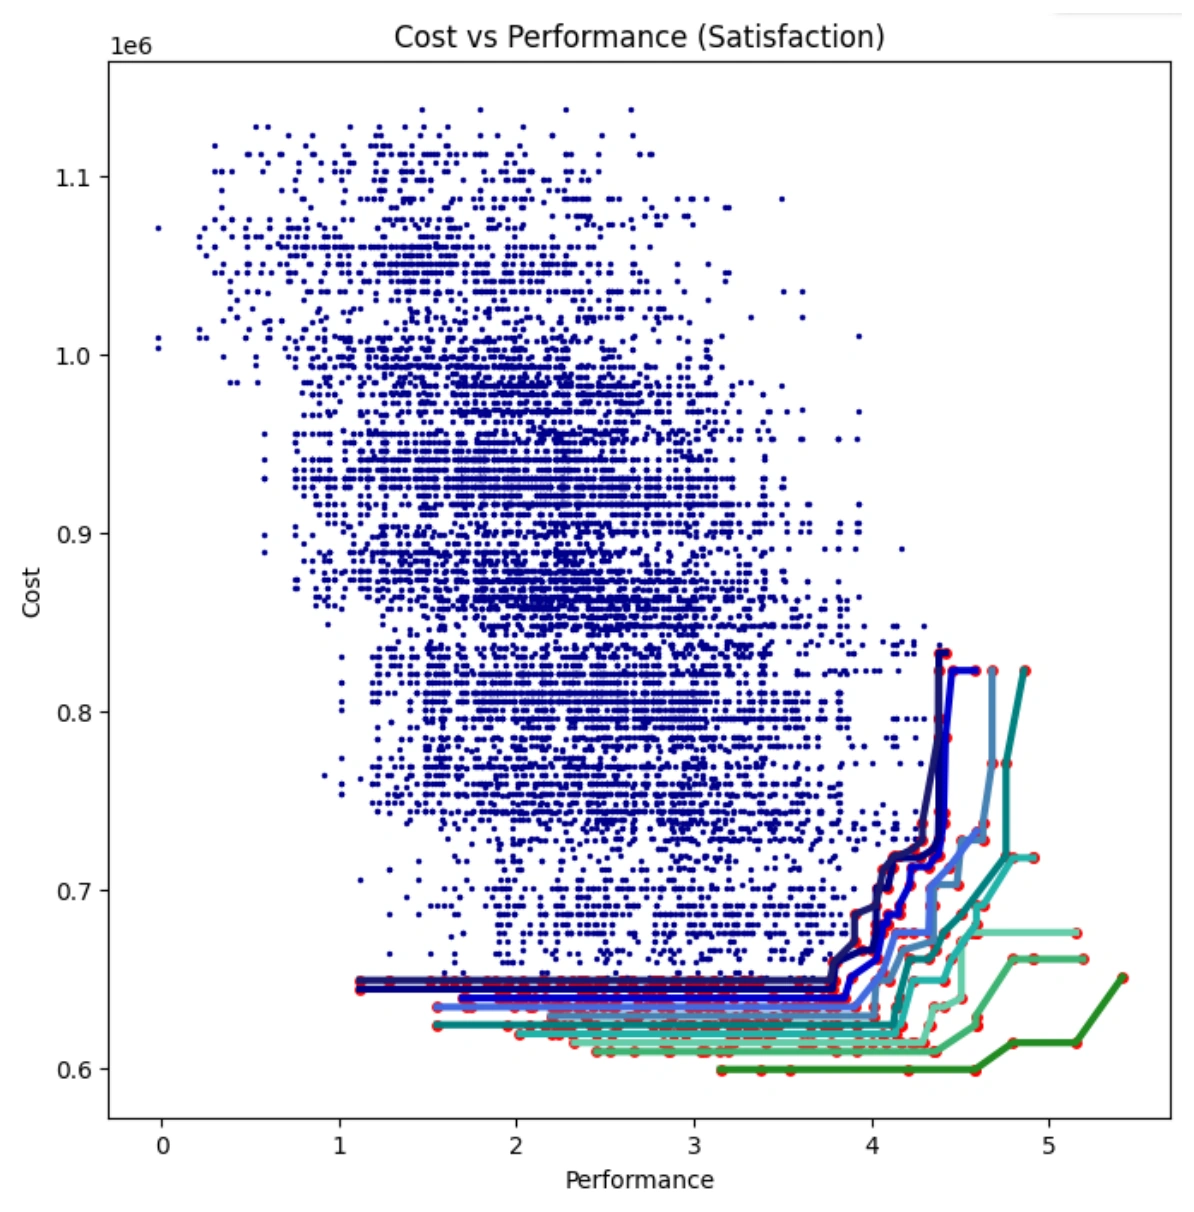
FIG. 3.9 / REPORT PP. 34–35
Put ten thousand candidates on the same page.
The horizontal axis is the report's performance measure; the vertical axis is modelled cost. The points show the candidate distribution, while the fronts narrow the comparison. Read the metric definitions and input sources alongside the pattern.
Why do options on the same frontier still need comparison?
The report uses generated architectures and simulated survey inputs. Positions in this plot are course-model results, rather than measured effects of an actual greenway.
FIG. 2.5 / P. 11 Ask whose needs became goals.Open the figure and commentary +
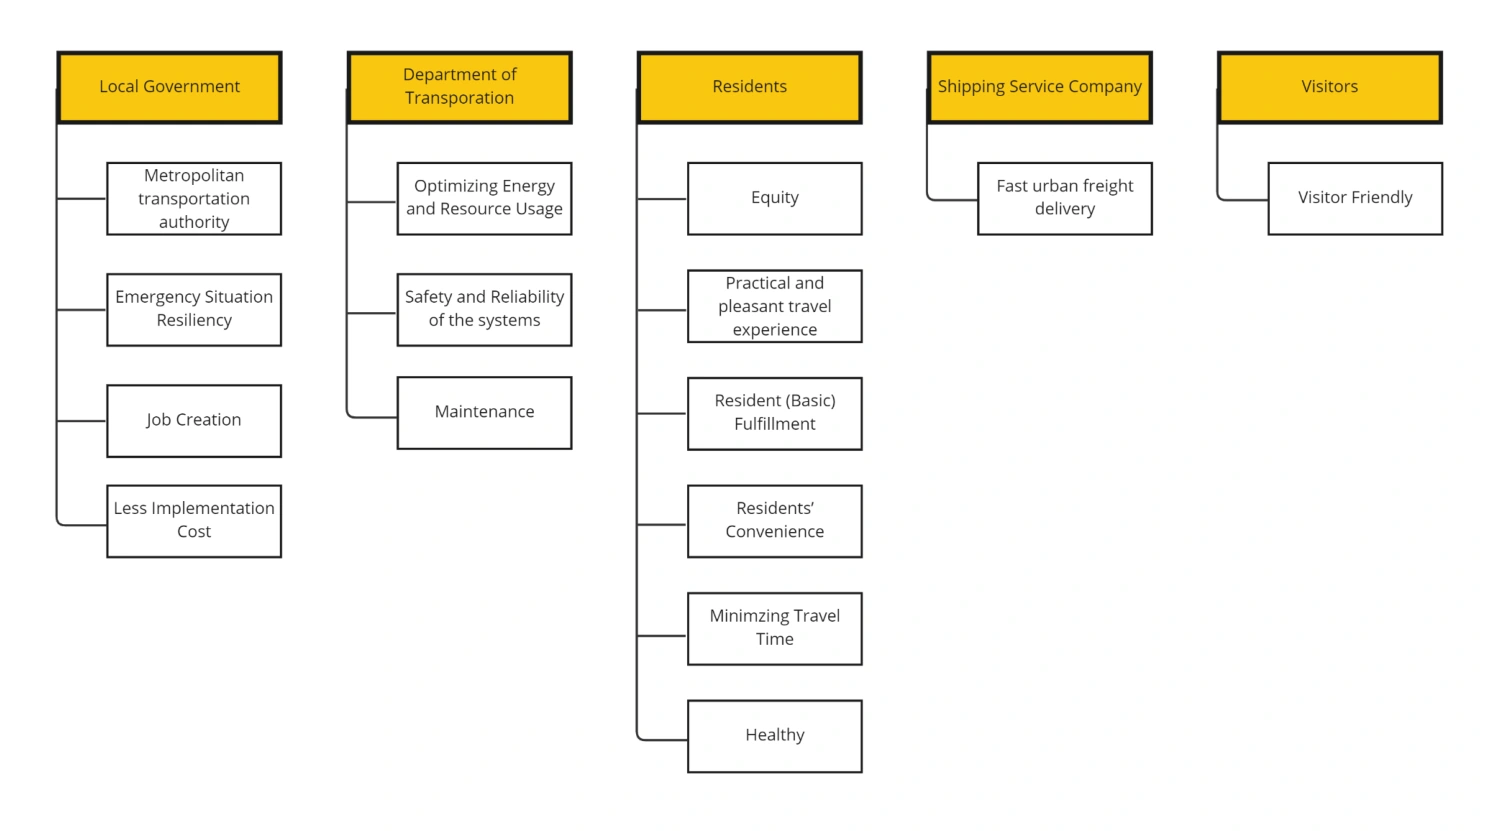
Residents, visitors, transport agencies and local organisations expect different things from a greenway. The original diagram separates those needs so that later measures can be traced back to the people they are meant to serve.
Whose experience could disappear from the ranking?
FIG. 3.13 / P. 40 Then inspect which choices reach further.Open the figure and commentary +
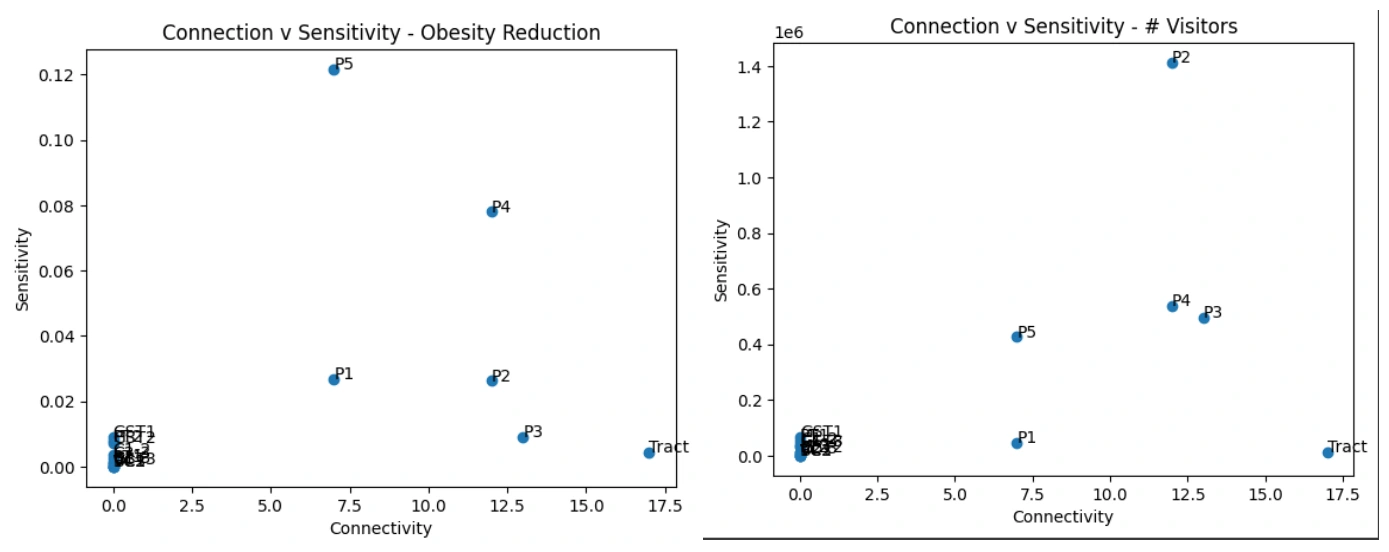
The pair of charts compares decision connectivity with metric sensitivity, helping the team discuss what to inspect first. Health-related and visitor measures here belong to the course model; the exhibit shows the analytical process.
Does a sensitive measure automatically deserve priority?
CHEME / SYSEN 6800 · 21 NOVEMBER 2022
Shared bikes: keep rentals and returns together.
The Citi Bike coursework examines a docked network where one station can run out of bikes while another runs out of space. Its model considers relocation costs together with penalties for unmet rental and return demand, using assumed station supply and demand.
The original records an incomplete implementation: the penalty terms were not correctly connected and the model returned zero relocations. This is a reason to inspect the implementation too: does the objective actually include the problem we want to address, and do the constraints express the intended design?
The experiment below reduces the question to three stations. Rebalance by hand, inspect each demand phase, then price all three outcomes: how much unmet service does one more move avoid?
Zero relocation can have very different explanations. An omitted penalty hides service loss from the objective. With all three costs included, expensive relocation may still make no movement optimal. Read the service gaps and cost breakdown alongside the minimum value. Below, change the penalties, inspect price boundaries and load an allocation back into the stations to check it.
Course number follows the original cover. Source locations: Model Introduction, Model Implementation and Conclusion. Read the project entry ↗
REBALANCE IT / AN INDEPENDENT 2026 DEMONSTRATION
A bike to borrow. A dock to return to.
Three fictional stations, eight docks each and twelve bikes initially. Rebalance first, then serve rentals followed by returns. Try to reduce unmet demand while keeping the number of moves in view.
B needs bikes, while A needs room for incoming returns.
Station A
7/ 81 empty docks
- Rental demand
- 1
- Return demand
- 4
Station B
1/ 87 empty docks
- Rental demand
- 6
- Return demand
- 0
Station C
4/ 84 empty docks
- Rental demand
- 2
- Return demand
- 2
Rebalancing preserves the total number of bikes. Each transfer counts as one bike moved.
Model assumptions and station-by-station results
Any two stations can exchange bikes directly; distance, travel time and equipment are omitted. Demand is known in advance. Rentals precede returns, ride durations are not tracked, and incoming bikes can come from outside the network. All situations and values are authored for this site demonstration.
| Station | Rebalanced | After rentals | After returns | Rental gap | Return gap |
|---|---|---|---|---|---|
| A | 7 | 6 | 8 | 0 | 2 |
| B | 1 | 0 | 0 | 5 | 0 |
| C | 4 | 2 | 4 | 0 | 0 |
OBJECTIVE AUDIT / THE SAME STATIONS, A DIFFERENT TRADE-OFF
Is a move worth it? Count the cost of leaving demand unmet.
Start with relocation cost alone, then restore the penalties for unmet rentals and returns. Every allocation is enumerated to find the lowest combined cost. All prices are fictional cost units for this exercise.
No moves. Zero counted cost.
5 rentals and 2 returns remain unmet.
At these penalties, the omitted service cost is 28 units.
Minimum total cost 5
Moves 5 + rentals 0 + returns 0 = 5 units.
A/B/C: 2 / 6 / 4; minimum 5 moves. 3 allocations share the minimum.
Current total cost 28
Moves 0 + service penalties 28 units; 23 above the minimum.
Charged for all 0 planned moves, including backtracking.
A displayed tie is resolved by fewer moves, fewer total unmet requests, then smaller A/B allocations. A zero penalty removes that service measure from the cost objective; it does not satisfy the demand.
Open the frontier: what do extra moves buy?
Keep allocations with a trade-off between relocation count and service penalties. Multiple allocations can share a point; a heavier ring marks a minimum-cost point at the current relocation price.
| Min. moves | Service penalty | Allocations at point | A / B / C | Action |
|---|---|---|---|---|
| 0 | 28 | 1 | 7 / 1 / 4 | |
| 1 | 20 | 1 | 6 / 2 / 4 | |
| 2 | 12 | 1 | 5 / 3 / 4 | |
| 3 | 8 | 2 | 4 / 4 / 4 | |
| 4 | 4 | 3 | 3 / 5 / 4 | |
| 5 | 0 | 3 | 2 / 6 / 4 |
Open sensitivity: when does the relocation price change the recommendation?
Hold rental and return penalties at 4 and 4; vary the relocation price continuously from 0 to 20 units. The table shows one optimum in each open interval. Fractions denote exact boundaries.
| Move price (open interval) | A / B / C | Min. moves | Unmet rent / return | Ties |
|---|---|---|---|---|
| 0 < c < 4 | 2 / 6 / 4 | 5 | 0 / 0 | 3 |
| 4 < c < 8 | 5 / 3 / 4 | 2 | 3 / 0 | 1 |
| 8 < c < 20 | 7 / 1 / 4 | 0 | 5 / 2 | 1 |
- Price = 0: 9 optimal allocations, with move counts 5 / 6 / 7.
- Price = 4: 9 optimal allocations, with move counts 2 / 3 / 4 / 5.
- Price = 8: 3 optimal allocations, with move counts 0 / 1 / 2.
- Price = 20: 1 optimal allocations, with move counts 0.
Audit all 61 allocations and costs
Every allocation is charged its minimum relocation count; distance and travel time are omitted. Total bikes stay at 12, each station holds 0–8, and rentals precede returns.
| A/B/C | Moves | Unmet rentals | Unmet returns | Move cost | Service penalty | Total | Optimal |
|---|---|---|---|---|---|---|---|
| 2/6/4 | 5 | 0 | 0 | 5 | 0 | 5 | Yes |
| 3/6/3 | 5 | 0 | 0 | 5 | 0 | 5 | Yes |
| 4/6/2 | 5 | 0 | 0 | 5 | 0 | 5 | Yes |
| 1/6/5 | 6 | 0 | 0 | 6 | 0 | 6 | — |
| 1/7/4 | 6 | 0 | 0 | 6 | 0 | 6 | — |
| 2/7/3 | 6 | 0 | 0 | 6 | 0 | 6 | — |
| 3/7/2 | 6 | 0 | 0 | 6 | 0 | 6 | — |
| 1/8/3 | 7 | 0 | 0 | 7 | 0 | 7 | — |
| 2/8/2 | 7 | 0 | 0 | 7 | 0 | 7 | — |
| 3/5/4 | 4 | 1 | 0 | 4 | 4 | 8 | — |
| 4/5/3 | 4 | 1 | 0 | 4 | 4 | 8 | — |
| 5/5/2 | 4 | 1 | 0 | 4 | 4 | 8 | — |
| 2/5/5 | 5 | 1 | 0 | 5 | 4 | 9 | — |
| 5/6/1 | 5 | 1 | 0 | 5 | 4 | 9 | — |
| 1/5/6 | 6 | 1 | 0 | 6 | 4 | 10 | — |
| 4/7/1 | 6 | 1 | 0 | 6 | 4 | 10 | — |
| 0/6/6 | 7 | 1 | 0 | 7 | 4 | 11 | — |
| 0/7/5 | 7 | 1 | 0 | 7 | 4 | 11 | — |
| 0/8/4 | 7 | 1 | 0 | 7 | 4 | 11 | — |
| 3/8/1 | 7 | 1 | 0 | 7 | 4 | 11 | — |
| 4/4/4 | 3 | 2 | 0 | 3 | 8 | 11 | — |
| 5/4/3 | 3 | 2 | 0 | 3 | 8 | 11 | — |
| 3/4/5 | 4 | 2 | 0 | 4 | 8 | 12 | — |
| 2/4/6 | 5 | 2 | 0 | 5 | 8 | 13 | — |
| 1/4/7 | 6 | 2 | 0 | 6 | 8 | 14 | — |
| 5/7/0 | 6 | 2 | 0 | 6 | 8 | 14 | — |
| 0/5/7 | 7 | 2 | 0 | 7 | 8 | 15 | — |
| 4/8/0 | 7 | 2 | 0 | 7 | 8 | 15 | — |
| 5/3/4 | 2 | 3 | 0 | 2 | 12 | 14 | — |
| 4/3/5 | 3 | 3 | 0 | 3 | 12 | 15 | — |
| 6/4/2 | 3 | 2 | 1 | 3 | 12 | 15 | — |
| 3/3/6 | 4 | 3 | 0 | 4 | 12 | 16 | — |
| 6/5/1 | 4 | 2 | 1 | 4 | 12 | 16 | — |
| 2/3/7 | 5 | 3 | 0 | 5 | 12 | 17 | — |
| 6/6/0 | 5 | 2 | 1 | 5 | 12 | 17 | — |
| 1/3/8 | 6 | 3 | 0 | 6 | 12 | 18 | — |
| 0/4/8 | 7 | 3 | 0 | 7 | 12 | 19 | — |
| 5/2/5 | 2 | 4 | 0 | 2 | 16 | 18 | — |
| 6/3/3 | 2 | 3 | 1 | 2 | 16 | 18 | — |
| 4/2/6 | 3 | 4 | 0 | 3 | 16 | 19 | — |
| 3/2/7 | 4 | 4 | 0 | 4 | 16 | 20 | — |
| 2/2/8 | 5 | 4 | 0 | 5 | 16 | 21 | — |
| 6/2/4 | 1 | 4 | 1 | 1 | 20 | 21 | — |
| 5/1/6 | 2 | 5 | 0 | 2 | 20 | 22 | — |
| 7/3/2 | 2 | 3 | 2 | 2 | 20 | 22 | — |
| 4/1/7 | 3 | 5 | 0 | 3 | 20 | 23 | — |
| 7/4/1 | 3 | 3 | 2 | 3 | 20 | 23 | — |
| 3/1/8 | 4 | 5 | 0 | 4 | 20 | 24 | — |
| 7/5/0 | 4 | 3 | 2 | 4 | 20 | 24 | — |
| 6/1/5 | 1 | 5 | 1 | 1 | 24 | 25 | — |
| 7/2/3 | 1 | 4 | 2 | 1 | 24 | 25 | — |
| 5/0/7 | 3 | 6 | 0 | 3 | 24 | 27 | — |
| 4/0/8 | 4 | 6 | 0 | 4 | 24 | 28 | — |
| 7/1/4 | 0 | 5 | 2 | 0 | 28 | 28 | — |
| 6/0/6 | 2 | 6 | 1 | 2 | 28 | 30 | — |
| 8/2/2 | 2 | 4 | 3 | 2 | 28 | 30 | — |
| 8/3/1 | 3 | 4 | 3 | 3 | 28 | 31 | — |
| 8/4/0 | 4 | 4 | 3 | 4 | 28 | 32 | — |
| 7/0/5 | 1 | 6 | 2 | 1 | 32 | 33 | — |
| 8/1/3 | 1 | 5 | 3 | 1 | 32 | 33 | — |
| 8/0/4 | 1 | 6 | 3 | 1 | 36 | 37 | — |
CHERRY STREET / DESIGN CONCEPT
A district online: what is here, and where next?
The Cherry Street presentation proposes a Business Improvement District as a future possibility. Its website and social-media concept helps visitors understand the place through area information, business and location maps, imagery, contact information and directions.
It considers starting with an existing visitor-information platform, then building an independent presence as the area develops. Social media, logos and other branding material are meant to connect to that presence. The material documents a proposal.
Building my own site brings me back to those practical questions: where does someone arrive, what do they want to understand, and where can they go next? Organising those routes deserves the same care as the visual design.
If I developed the proposal further, I would review one visitor journey: after finding a business, can someone confirm its location, get directions and return to exploring the district? Then I would switch to upkeep: who updates a changed listing, and do the map and social channels change with it? These are checks I would add in a present-day review.
Source locations: Website Focus, Future Website Development and Connections with Other Branding Methods. Read the project entry ↗
AFTER READING / THE CONVERSATION
What would you add?
Add an experience, ask a question or point out a correction. Both language editions share this article’s discussion.
Public comments are not open yet. Keep a draft on this device, or send your thoughts through the contact page.
Write a local draft
Only “Save on this device” stores the draft. Clear it on shared devices; it is not published automatically.
0 / 1600